
We built this update to address this common feedback:
My friend got a much higher Utility Rating than me, but they only threw one flash and one HE all match. How can someone who barely threw any nades have a better Utility Rating than someone who is throwing vital default utility every round?
We agree - a big part of CS is throwing nades which condition the enemy team and force them not to take space on the map. If someone only throws 2-5 nades in the entire match, it doesn't make sense that they can get 80+ Utility Rating for that match, even if the nades they did throw were perfect.
Our updated Utility Rating reflects both of these aspects: Quantity, and Quality. You get a rating from 0-100 on both Quantity and Quality, and those combine to form your overall Utility Rating.
What does that mean for you? To get a high Utility Rating for a match, aim to throw multiple pieces of util each round, and your HEs and Flashes also need to consistently be interfering with the enemies.
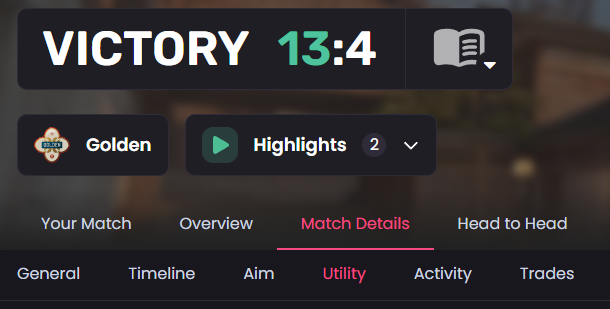
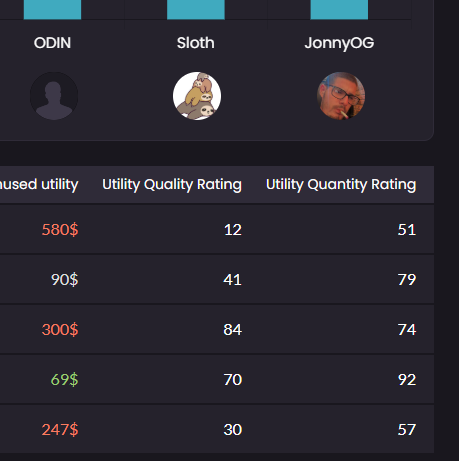
To find these sub-ratings for your each match you play, go to Match Details -> Utility. They are the final two numbers in the detailed stats table.
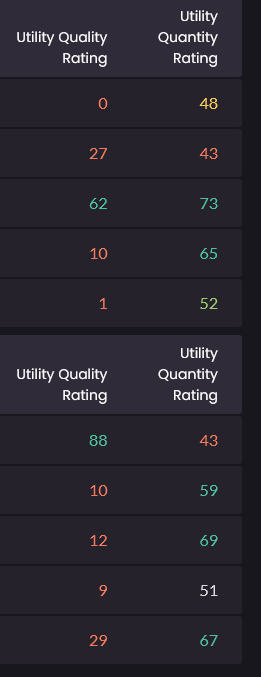
This example shows that even if you get a 88 Quality Rating, but have a 6 Quantity Rating, you'll only get an overall Utility Rating of 22 for that match:
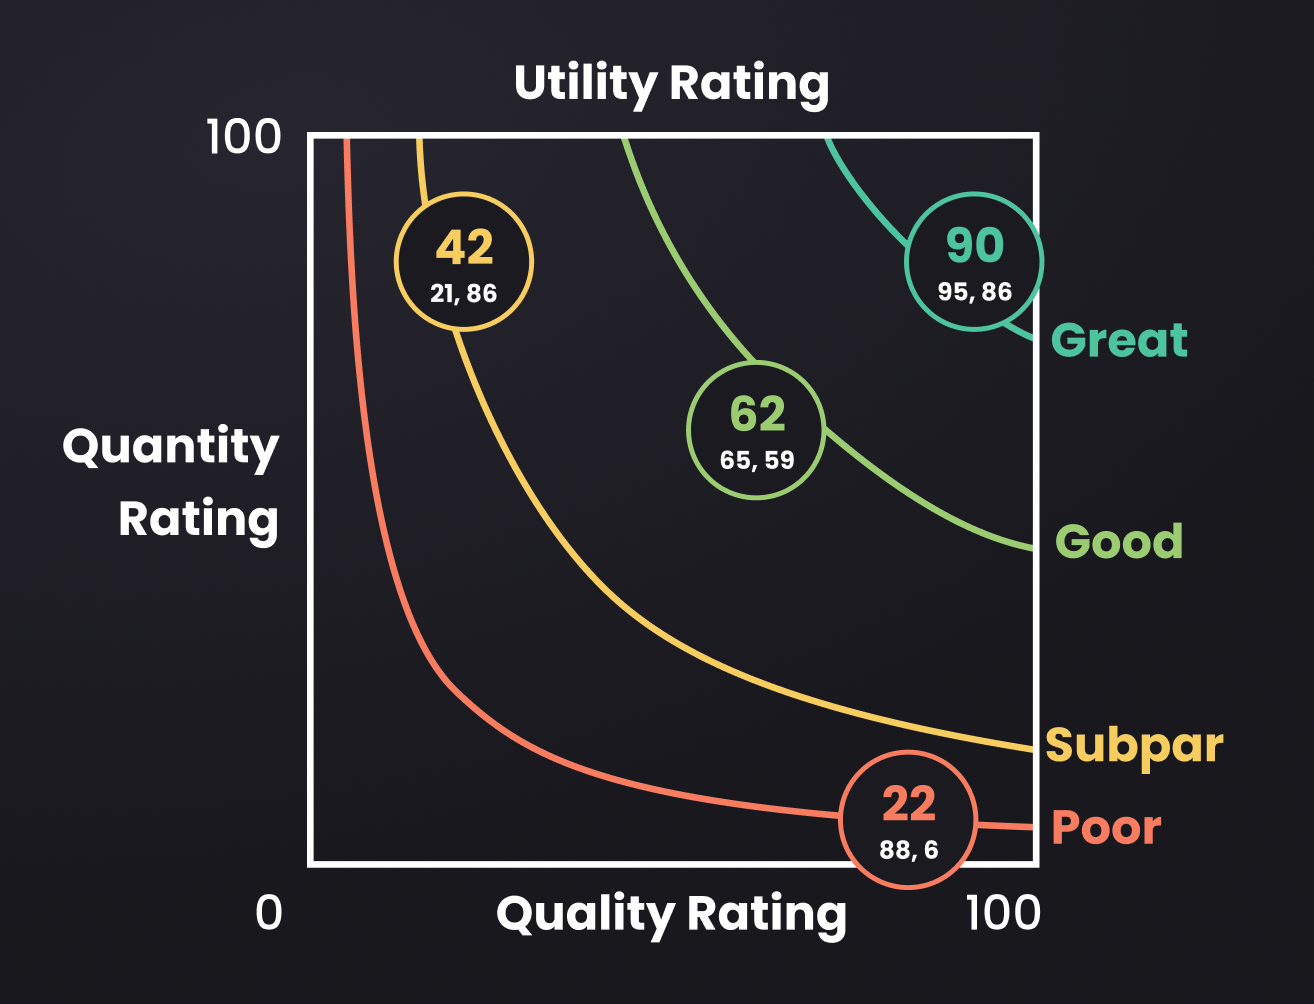
This is because we use the Geometric Mean to calculate overall Utility Rating from the sub-ratings. This method of combining them favors cases where the numbers are closer together, but punishes you more harshly than a standard mean if one rating is far below the other.
Keep reading for way more info on how these are calculated - if you just showed up for the basic explanation, you can stop here. Thanks for reading!
How is Utility Quantity Rating calculated?
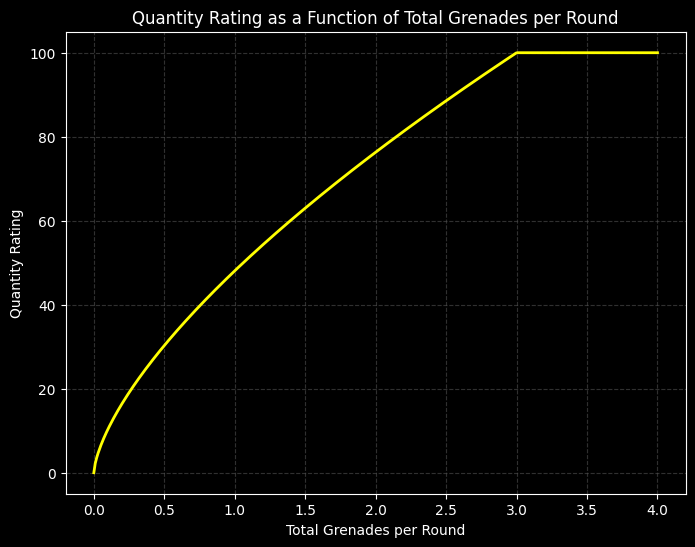
The steps to calculate Quantity Rating are:
- Determine the average number of grenades thrown per round (excluding decoys)
- Calculate what percentage that number is compared to an expected value of 3 per round (report this percentage as a decimal, so 0.00 to 1.00)
- Take x^(2/3) to rescale the values from a linear to remap the rating to have exponential falloff
- Multiply your decimal value (0.00 to 1.00) by 100 to get a 0 to 100 rating.
Going above 3 nades per round will still result in a Quantity Rating of 100.
How is Utility Quality Rating calculated?
Quality Rating is much more complicated. This is what we used to just call "Utility Rating" on Leetify, before we introduced the Quantity component with this update.
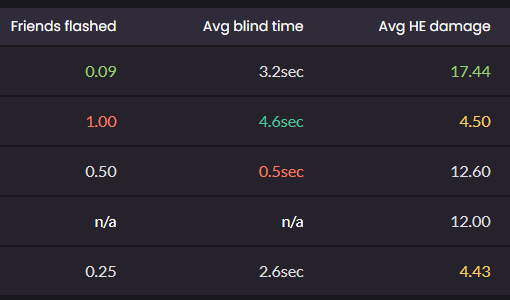
We first find the z-scores for the individual skills on the Utility Tab of the Match Report.
The simple way to think of this is: If it's green, it's pulling your Utility Quality Rating towards 100. If it's red, it's pulling your Utility Quality Rating towards 0.
NOT ALL STATS ON THE UTLITY TAB INFLUENCE IT THOUGH! The stats that factor into Utility Quality rating are:
- Flash Assists %
- Enemies Flashed per Flashbang
- Friends Flashed per Flashbang
- Average Blind Time per Flash
- Average HE Damage per HE
- Average HE Team damage per HE
The actual math to calculate Quality Rating is then:
// The formula behind Quality Rating is:
x = (userStat - statAvg) / statStd

// For the “inverted” stats (lower=good), HE Team Damage and Friends Flashed, we flip the values:
x = x * -1

// And finally the z-score for each individual stat:
zScore = x * sqrt(matchesCount)

// We then calculate the weighted sum as:
S = sum(zScore_i * weight_i)

//And find the total variance of the z-scores, simply as the sum of the squared weights multiplied by the match count, since each z-score, by definition, has a variance of 1.
Var(S) = sum((weight_i*sqrt(matchesCount))^2)

//Then finding the combined z score is done like this: (again since z-scores also have a defined mean of 0)
zCombined = S / sqrt(Var(S))

//Finally this is put into the standard normal cumulative distribution function (CDF) - standard normal just means mean = 0 and stdev = 1, in case the function to compute this wants those parameters:
Quality_rating = snCDF(zCombined) * 100
How is the overall Utility Rating calculated?
We take the geometric mean of the Quantity Rating and Quality Rating. This gives you another 0-100 Rating that favors the case where both of your underlying Ratings are high.
We used the geometric mean because it favors the case where both of your ratings are approximately equal, and it's a bit more punishing when you have one really high number and one really low number.
For example, getting 55 Quantity Rating & 60 Quality Rating will give you an overall Utility Rating of 57. However, getting 100 Quantity Rating and 5 Quality Rating only gives you an overall Utility Rating of 22. You must do well in both categories to get a great Utility Rating!
Luke Persola explains this nicely in the article Visualizing the Geometrics & Harmonic Means:
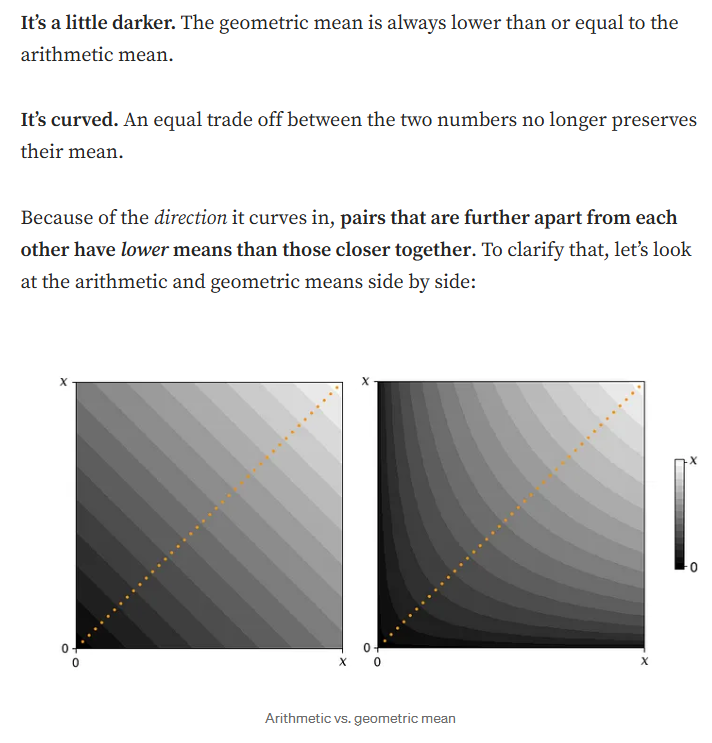
What does this mean for benchmarks?
Most people are seeing a boost to Utility Rating from this update, especially at higher ranks.
Since many people who threw lots of default utility were getting punished for some of that not landing, Utility Ratings used to be very low on average. Many CS players were getting Utility Ratings in the 10-30 range, and even professional players were commonly landing in the 40-60 range.
After this update, more players will land in the 50-60 range on average, with pros getting 70+. The rating does still stretch from 0-100, so you'll still see some players at both extremes in your matches.
| Rank | Old Average | New Average |
|---|---|---|
| HLTV | 58 | 70 |
| 1000-4999 | 47 | 50 |
| 5000-9999 | 49 | 56 |
| 10000-14999 | 51 | 59 |
| 15000-19999 | 52 | 62 |
| 20000-24999 | 54 | 65 |
| 25000+ | 56 | 66 |
| FACEIT 1 | 28 | 48 |
| FACEIT 2 | 31 | 53 |
| FACEIT 3 | 31 | 54 |
| FACEIT 4 | 32 | 56 |
| FACEIT 5 | 33 | 59 |
| FACEIT 6 | 34 | 60 |
| FACEIT 7 | 35 | 61 |
| FACEIT 8 | 36 | 62 |
| FACEIT 9 | 37 | 63 |
| FACEIT 10 | 39 | 65 |
The color coding for the sub-ratings on Match Reports (Utility Quantity Rating and Utility Quantity Rating) assumes that the average is 50 and the standard deviation is 10. Here's an example of how that gets color-coded:
Sneak Peek for the Future
We wanted to implement the math first and give you a chance to give feedback. Please share that with us on Discord or via email.
Once we're happy with the underling math for the Quantity and Quality Ratings, we plan to release a visual overhaul of the Match Details -> Utility tab so that it's easier to answer:
- Why did I get this overall Utility Rating?
- Why did I get this Utility Quality Rating?
- Why did I get this Utility Quantity Rating?
- How does that compare to everyone else in the match?
SHHHH! Don't share this, but here's an early design concept for this (special treat for you for reading this far in the article). It's likely to change a bit before release, feel free to share feedback on anything you want included here!
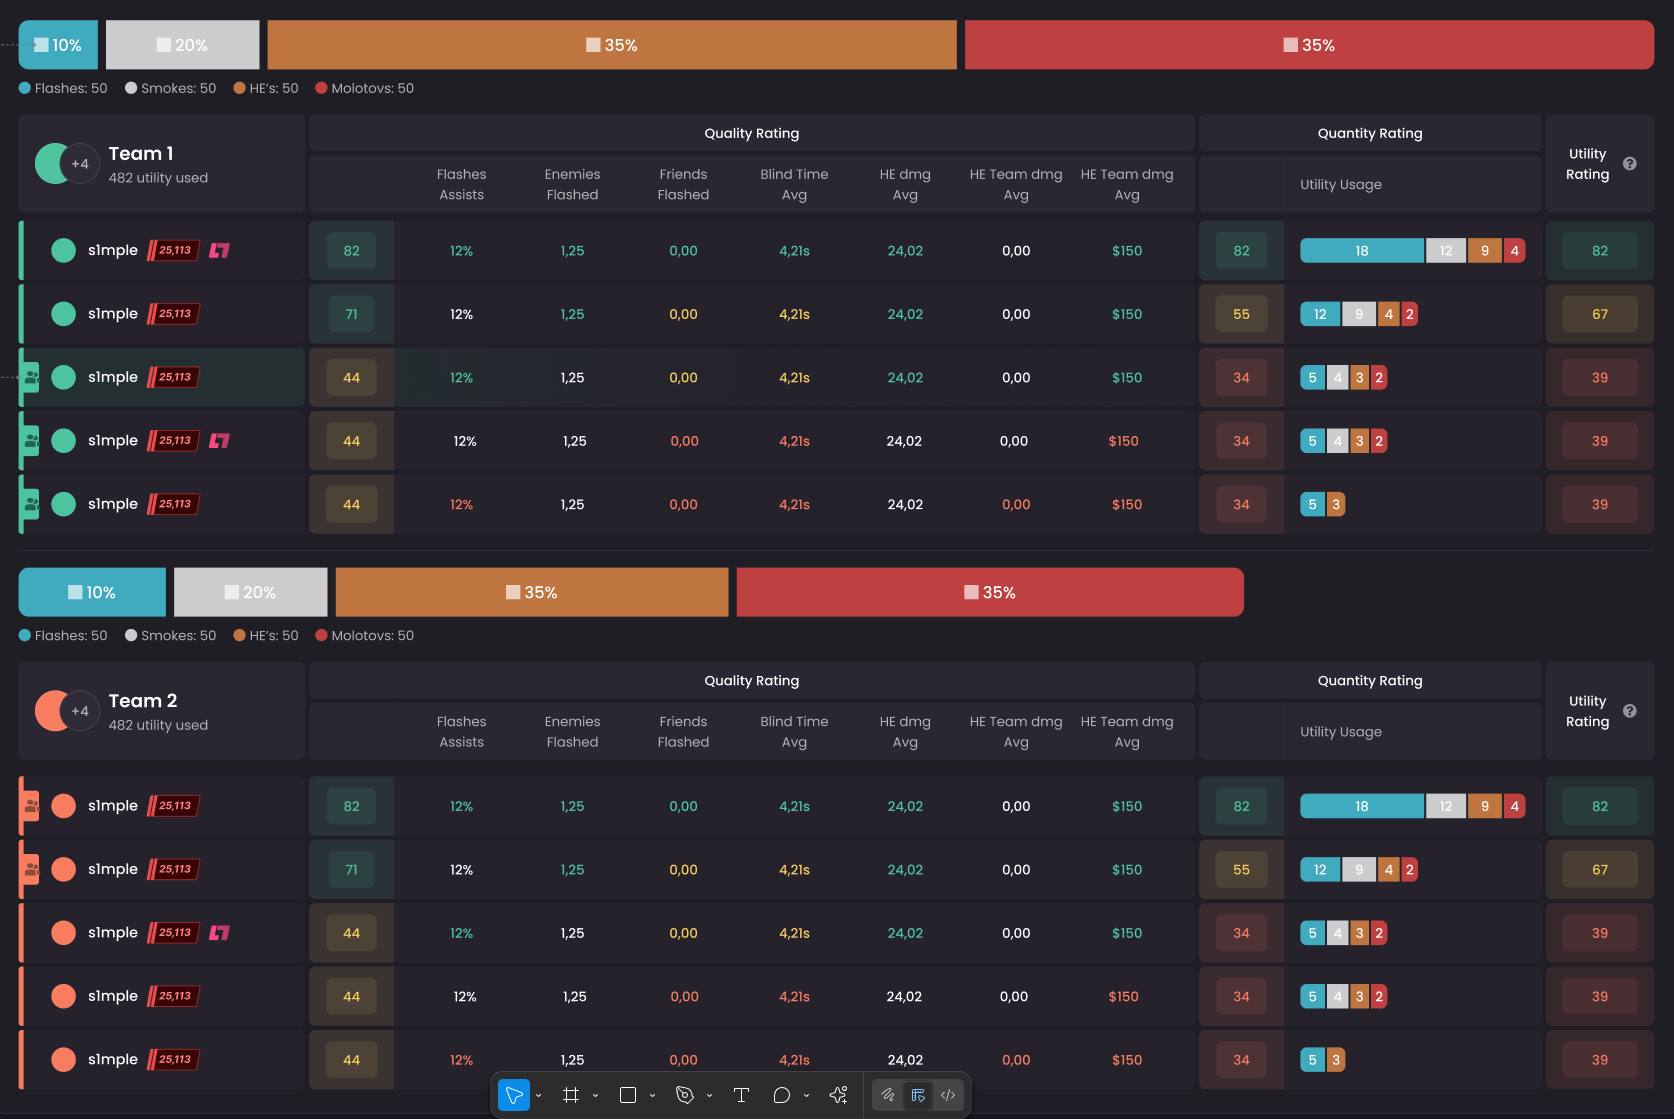
This change wouldn't be possible without the amazing feedback we get from you, our community <3 thanks from all of us for using Leetify!